Tableau Conference 2025
An engineer's perspective
BLUF (Bottom Line Up Front): The data visualization industry is transforming through AI integration. To stay ahead, we should: 1) Move business logic from visualization tools to the data layer, 2) Invest heavily in metadata and semantic layers, and 3) Strengthen our data governance framework.
Tableau is a major player when it comes to data visualization, and they just hosted a conference in San Diego, California to launch new features and explain their agentic era: how a data visualization company is positioning itself for the AI revolution, and a word of advice to data analysts on how to adapt in this transforming season the industry is going through.
Here are my main takeaways as an engineer attending a conference that used to be focused primarily on data analysis:
The "move to the left" movement
The usual diagram to describe the flow of data usually starts with all the data sources on the far left, and then multiple arrows go from there, passing through many boxes in the middle where the ETL (Extract, Transform, and Load) processes happen – or in our case ELT – and the final step is the data destinations such as Tableau where all the data is visualized for impactful ministry decisions.
One mistake we (and many others in the industry) have made over the years was to build business logic on the visualization tools. They are usually hidden in a form of calculated fields within published data sources in Tableau or, worse yet, inside isolated Tableau workbooks and views that are being used on final dashboards for leaders to use and make executive and ministry decisions.
The issue here is that these calculated fields are gold with precious business logic locked in a data visualization tool, that if done well is in a published data source so that other workbooks and views can benefit from it or worse, these precious business logic can be hidden in a workbook, so that if another data analyst needs that logic they will have to rebuild it, creating what all of us data professionals hate the most: same metric, different results.
The advice here is to move all the business logic to the left, closer to the data. Rebuild those precious and rich calculated fields packed with CASE and IF statements and move them away from the visualization layer, back to the data layer.
The main immediate benefits here are:
Unlocking the business logic from the visualization layer and making it available to all data destinations that might benefit from knowing key metrics that our organization cares about
It eliminates or minimizes the risk of having to recreate the same metric which significantly increases the risk of the same metric reporting different numbers
Bringing the logic to the data layer allows agents (GPTs) to read our entire diagram codified with all the declared data sources, SQL transformations, and finally all the business logic with the proper description so that it quickly answers leader questions like "what is this metric?" and lineage questions such as "where did you get this data?" and even for other data engineers, it helps us to build other queries using existent components found in the diagram.
Now, let's address the elephant in the room. If you are a data analyst, even the idea of eliminating calculated fields probably makes you cringe a bit. I get it. I will confess that my immediate reaction when I heard this advice was like "That's it! Let's all stop the calculated fields for good", but a more non-nuclear approach proposed in the conference was to keep giving analysts the freedom to do what they do best: create with leaders all the business logic they need using the tools and language they are used to; and we, the engineers, simply need to pay attention if those new dashboards will take off and have high visibility; if so, then that's the signal for us to go ahead and move those rich business logic back to the data layer so that other analysts, data destinations and GPTs can benefit from it.
Action Step for us:
Explain to leaders and other data analysts the benefits of this approach
Find the most popular dashboards and start transitioning those calculated fields to the data layer
Implement a process to continually look for new and popular dashboards and migrate any calculated fields to the data layer
Metadata, Metadata, Metadata
I am sure you have been there before; you have a problem to solve and have spent hours finding the solution. Now it's time to double-check with a know-it-all GPT to ensure you are not going crazy with this novel and perfect solution you found out. But quickly you realize that whatever GPT you are using, knows nothing about you or the problem. It has access to your solution, but it also has no idea of what other data assets you have available to use to give you the most efficient answer or even find a much better and more concise solution to your problem.
And this is not an issue just for the data professionals; if you are a leader or a pastor trying to understand what data points are available for you to make a huge impact on your organization; if one of them goes to a GPT they are in a much worse place because they might not have any tools to provide GPT with the context it needs.
In this AI revolution you often hear that data is gold, well if that's the case, then metadata must be the harvesting tool we need.
The advice here is to ensure that all data assets you have are packed with metadata because all this metadata will later become part of your prompt to a GPT; it will give GPT all the context – data source, ETL process, business logic and data destination – so that when you come with a problem to solve or a simple question about what data point is available it has all the context it needs to assist you to find the answer quickly and effectively.
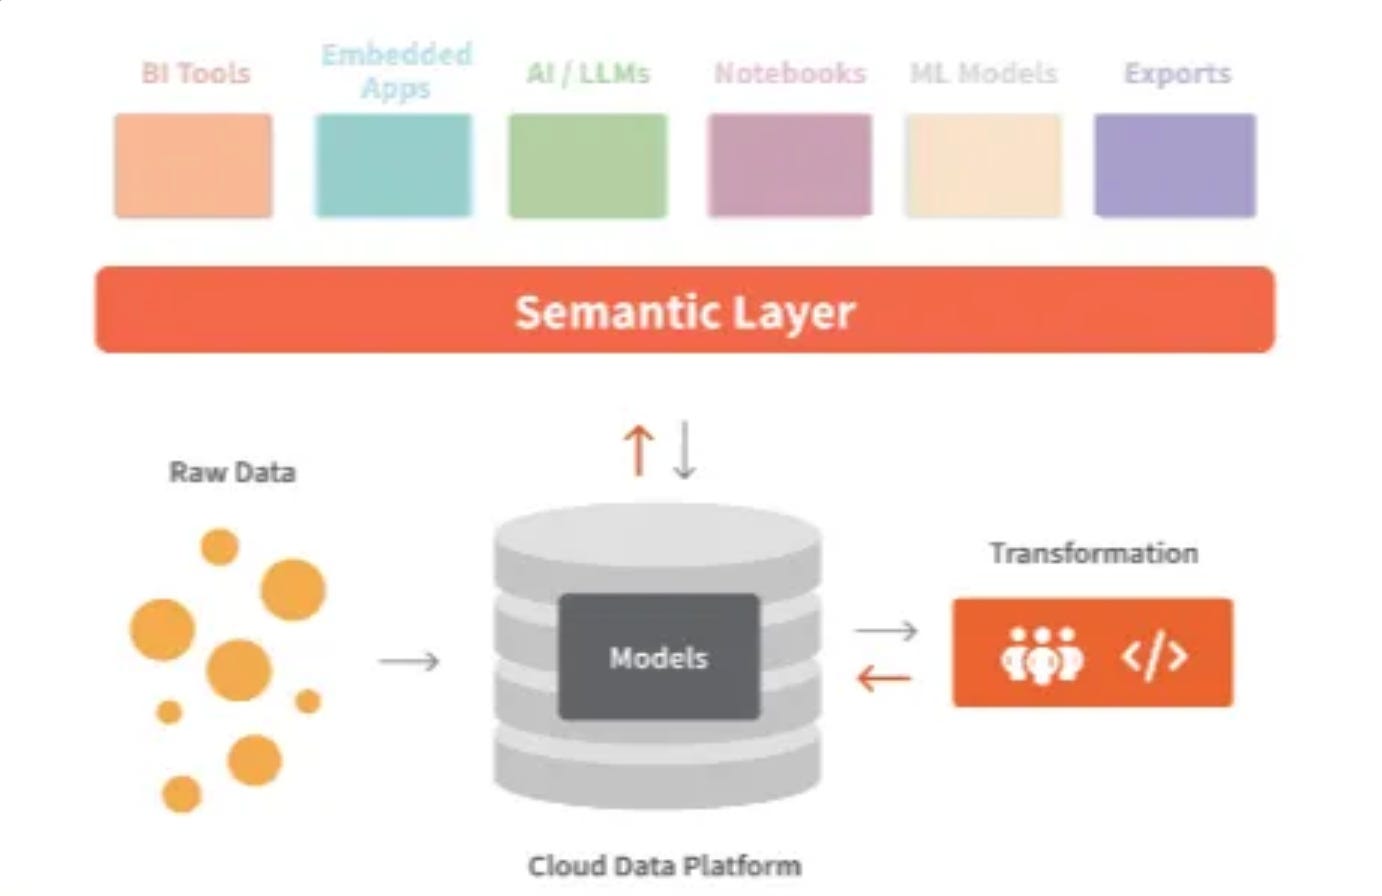
And according to the conference and my own research, something like dbt or Dataform provides you the tools you need to metadata everything, but then dbt and Cube Dev go one step beyond by offering a way for you to build a semantic layer, a universal layer that allows you to move your business logic and definitions everywhere you go while providing a standard framework to write documentation as code where all metrics, entities, and relationships of your data are declared, which is exactly what a GPT needs to shine at its job.
This is an image I saw often at the conference that explains well that all the standard ETL/ELT process is still needed, and the semantic layer comes on top of it to allow what they called "data portability" where you "define once, use everywhere" on Tableau or any other data destinations including LLMs to answer simple questions and help engineers build new data models.
Another benefit of having a semantic layer is that it breaks what I call the data loop: someone asks for an analysis, the data analyst tries to find a dashboard or a table in the warehouse that answers that question, but nothing does, so they contact the engineer who will then find in the raw tables something that needs to be transformed properly, tested and deployed to the warehouse, so that the analyst can take it, analyze it and finally answer the question to the leader who now has four new questions.
The semantic layer helps us reduce or even eliminate the data loop because it empowers analysts to safely join things, it empowers GPTs to assist engineers in developing new queries, and it equips non-technical people to browse a comprehensive data dictionary and even, in a future not too far away, to safely query our data.
Action Steps for us:
The "garbage in, garbage out" rule is still true, so we need to get ready for the semantic layer by simplifying our data models and adding all the metadata to them.
Find and implement a semantic layer solution
It's time to govern like never before
If you thought that data governance was important, it just became a lot more critical. The main idea of Tableau is to democratize data, and the "move to the left" and metadata approach definitely invites more people to do data with us, which also raises the risk of bad analyses and bad queries.
That's why we will have to focus more and more on data governance so that GPTs and others can get their answers safely.
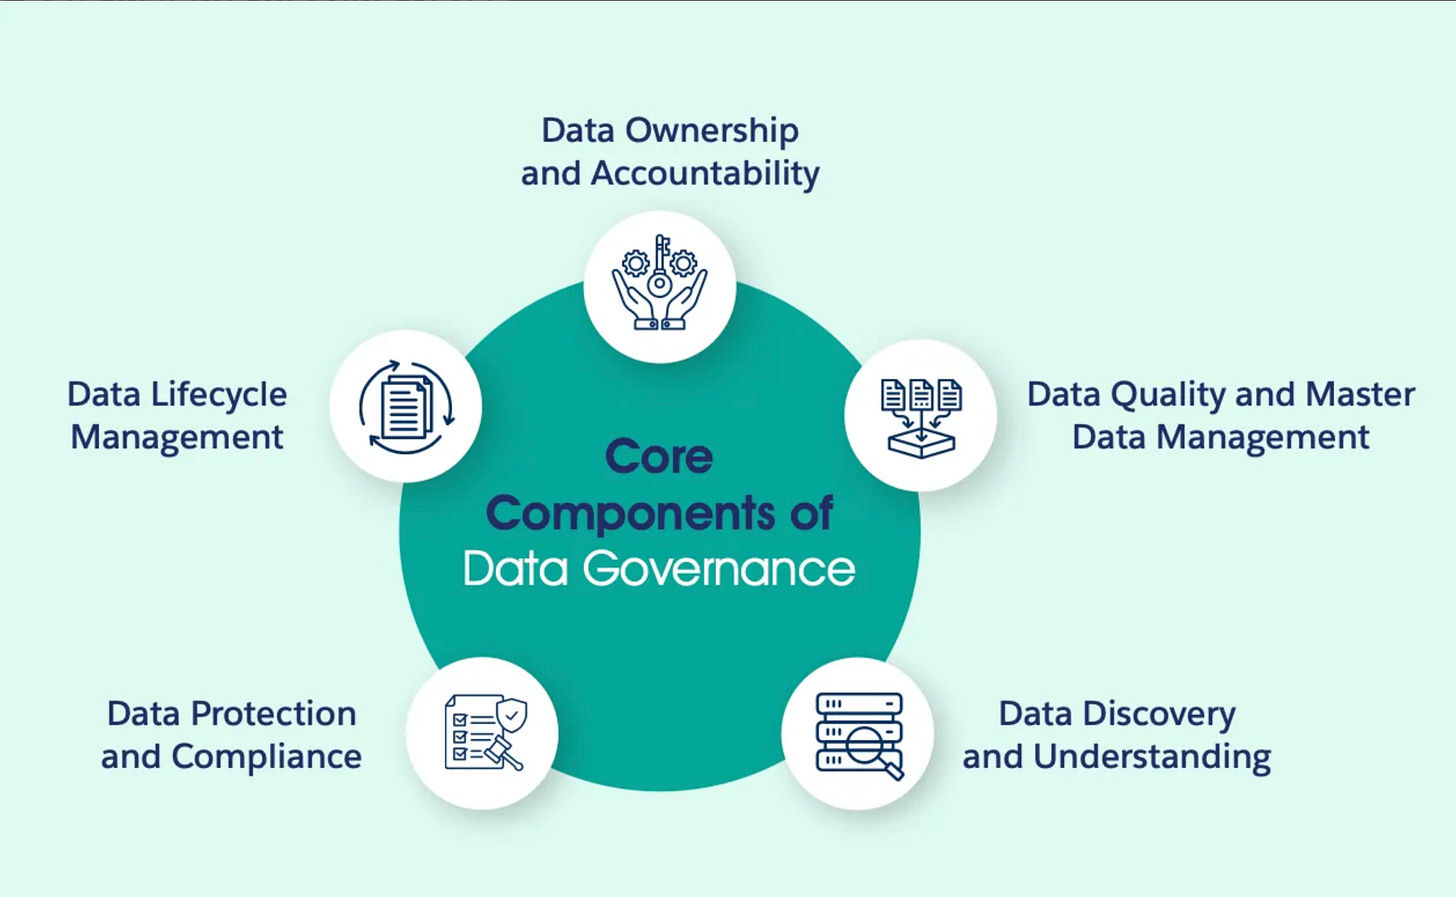
Tableau provided this framework about the core components of data governance that we should pursue:
As I reflected on these components and attended multiple sessions, I heard and saw enough things sprinkled here and there to help build a more solid picture of what this looks like in real life.
The main ones that caught my attention were:
Data Lifecycle Management: We all love to create new things, but archiving obsolete data that no one else uses should be part of our routine, and as exciting as launching a new and shiny thing.
Data Quality and Master Management: Test coverage was my takeaway here. The recommendation is to break long queries into small queries (they call them data models), which allows us to reuse these small pieces of logic in more places and test them individually to ensure the data pipeline is moving from sources to the dashboard as expected.
Data Discovery and Understanding: It goes back to the semantic layer and the metadata concept. It reinforces the idea of documenting everything, so that we can search for data points using natural language and combining all business logic in one place; "define once, use everywhere."
Action Steps:
Add metadata to all data assets
Expand test coverage to 100%
Define and implement data lifecycle
Launch a data dictionary


