
Breaking the Data Loop: Our Journey to 100% Data Quality Coverage

BLUF (Bottom Line Up Front): We've increased our data testing coverage from 7% to 60% by implementing systematic quality checks and leveraging AI assistance. This approach ensures data accuracy, reduces the "data loop," and enables truly self-service analytics for ministry leaders to make timely, data-driven decisions.
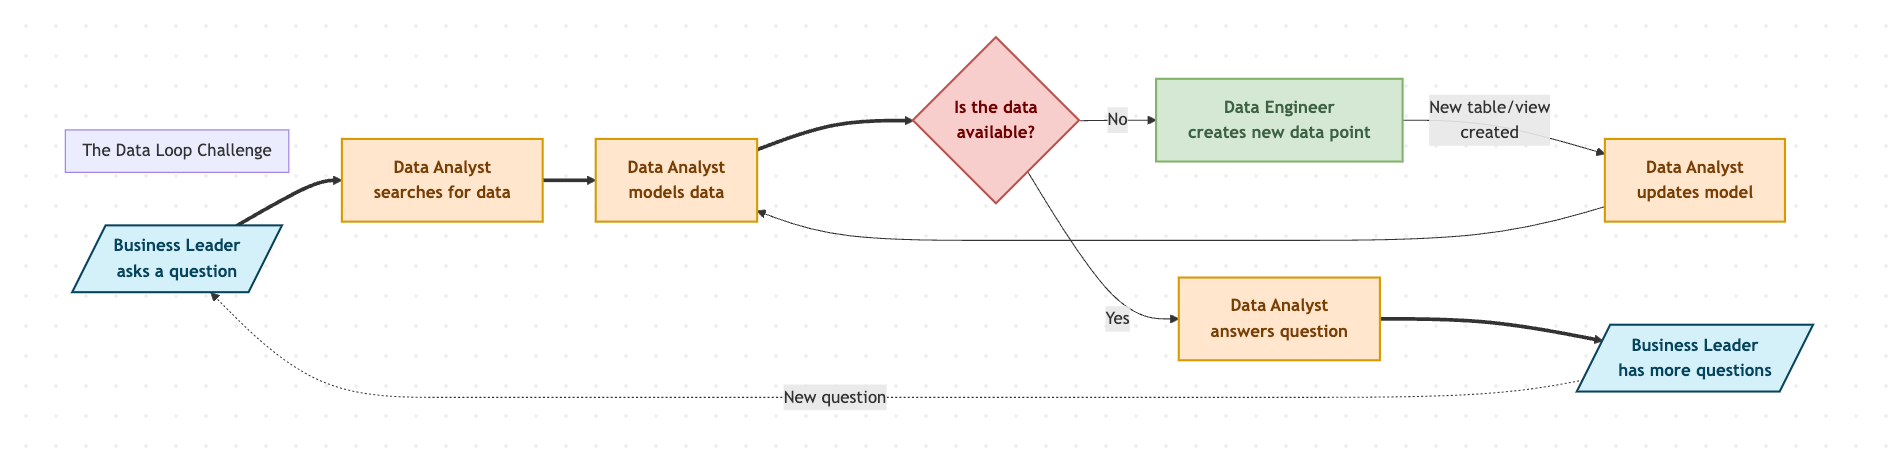
The Data Loop Challenge
We are on a journey together, right? How to break the data loop? I've been talking about this so much that I decided to create a diagram to illustrate the loop:
Here is the mermaid code in case you want to adjust it a bit:
flowchart LR
    %% Define node styles
    classDef leader fill:#D4F1F9,stroke:#05445E,stroke-width:2px,color:#05445E,font-weight:bold
    classDef analyst fill:#FFE6CC,stroke:#D79B00,stroke-width:2px,color:#783F04,font-weight:bold
    classDef engineer fill:#D5E8D4,stroke:#82B366,stroke-width:2px,color:#3D6143,font-weight:bold
    classDef decision fill:#F8CECC,stroke:#B85450,stroke-width:2px,color:#6E0000,font-weight:bold,border-radius:10px

    %% Nodes with improved descriptions
    A[/"Business Leader<br/>asks a question"/]
    B["Data Analyst<br/>searches for data"]
    C{"Is the data<br/>available?"}
    D["Data Analyst<br/>models data"]
    E["Data Engineer<br/>creates new data point"]
    F["Data Analyst<br/>updates model"]
    G["Data Analyst<br/>answers question"]
    H[/"Business Leader<br/>has more questions"/]

    %% Applying styles
    class A,H leader
    class B,D,F,G analyst
    class E engineer
    class C decision

    %% Connections with labels and styles
    A ==> B
    B ==> D
    D ==> C

    %% Data missing branch
    C -- "No" --> E
    E -- "New table/view<br/>created" --> F
    F --> D

    %% Data available branch
    C -- "Yes" --> G
    G ==> H

    %% Close the loop with styled edge
    H -. "New question" .-> A

    %% Add a title
    subgraph "The Data Loop Challenge"
    end
In order to reduce this loop, we are trying to empower analysts or even business leaders to ask questions without having to go through the entire cycle. But to get there, we concluded that we need to clean up our data assets (as discussed last week) and ensure data accuracy. Here's the deal: if we want to empower non-technical people to interact with data without supervision, we need to be sure that our data is reliable enough that no one needs to "double-check" it.
From 7% to 60%: Our Quality Testing Journey
You might be shocked to know that out of our entire data warehouse, only 7% of our assets had some sort of quality check to validate the data. The way we were operating was simply developing new queries with the data analyst, validating the data at that point, and if everything passed our initial validation, we would deploy the new asset to our warehouse.
But surprise, surprise, data changes. An asset can start reporting bad data, and people can make decisions with it without noticing a subtle change in the backend causing a metric to go in the wrong direction.
For that reason, we set a goal to raise our data coverage from 7% to 100%. We're actually working toward that goal right now. We are currently at 60% coverage and increasing.
How Dataform Assertions Work
What does that mean in practice?
At our church, we use Dataform to transform our data. It's a very helpful tool similar to dbt but with the advantage of being within our BigQuery environment.
The way Dataform works, you define data models in a SQLx file, where a config header is required. This config header includes many settings including what are called "assertions," which are quality tests that run right after a SQLx file is executed.
There are a few useful assertions that we can apply to our data. Some are very simple, such as defining what a unique row looks like in this model (e.g., IDs or a combination of columns) and columns that should never be null for each particular model. I know this is database 101, but when you use a data warehouse such as BigQuery that is very flexible with database structure, quality checks like these can go unnoticed, causing your data to not behave as expected.
The assertions also give you the ability to add row condition tests. While the body of your SQLx defines the business logic with SQL-like code, you can set your row condition assertion to test it. And I'll be honest, it feels redundant sometimes because it feels like you're already excluding bad data with proper joins and WHERE clauses. Many times I thought to myself, "OK, this assertion is not needed," but guess what? It was needed. It caught things in the data that I wasn't even aware existed.
Surprising Findings from Quality Testing
Another common row assertion logic that we're putting in place is to catch bad data entry. Our church started in 1996, and we're in 2025. How is it possible that someone got baptized in the year 0225? I know, I know, this type of bad entry should have been caught further left in the system that allowed the entry, but nevertheless, the data made it through our data warehouse, causing our reports to be inaccurate. This extended the data loop because business leaders were questioning the integrity of the data. Without an assertion looking out for us, it would be painful to find those eight bad records claiming someone was baptized in 225 A.D.
Another lesson we learned is that if we already tested all the underlying tables of a view, there's no need to test the view itself, right? We were surprisingly wrong about that assumption. Having assertions on the view level requires the view to actually run, and we found that we had a few views that had good tables behind them but, thanks to bad syntax, the views weren't actually running. Again, these views were published and live in the data warehouse, meaning it's possible that a dashboard was connected to such a view. If a business leader tried to open that dashboard, it would trigger the execution of the view, which would have failed, leading the business leader to come back to us with questions—triggering the whole data loop again.
This rigorous testing approach directly supports our goal by ensuring that ministry leaders can trust the data they're using for decision-making.
Alfred: Our AI Assistant for Test Coverage
Now, let me be honest with you, adding assertions to assets is not fun. We need to understand the data model, think of ways to test it, and having to fix the issues the assertions are finding is even worse. So we had to come up with a way to speed up this process.
That's why we created Alfred. Alfred is not an acronym for something smarter; it's just a reference to the Batman movies where Alfred was a major helper. Alfred is a Claude Agent that we created to be another data engineer on our team. We have provided Alfred with all the context we have documented (we'll talk about documentation next week) and our standards for quality testing. Now, every time we need to create assertions, we can start by copying and pasting the SQLx to Alfred so we can work together on developing ways to test if the business logic is being implemented correctly.
Alfred has definitely sped up our process. We were at 7% coverage two months ago and have already hit the 60% mark thanks to Alfred.
The Interconnected Warehouse: Unexpected Benefits
One side effect of adding assertions to every model in our data warehouse is that every time we try to publish a new model, all assertions are tested to make sure we're not breaking anything while deploying something new. And I don't know how we made it this far without the assertions, because we're finding out that our warehouse is so interconnected. A merge request is taking longer to be approved because all these assertions are thankfully catching issues before they become problems.
That's how we're making progress toward our vision of an AI-ready and self-service data warehouse—reducing obsolete data assets and making sure the ones that remain are well-tested. This approach directly supports our goal by ensuring accurate data that truly represents our ministry impact.
Next step? We need to talk about documentation. Stay tuned for next week's post!